This feature is available for DB2/LUW, Oracle, MS SQL Server, PostreSQL and DB2 z/OS.
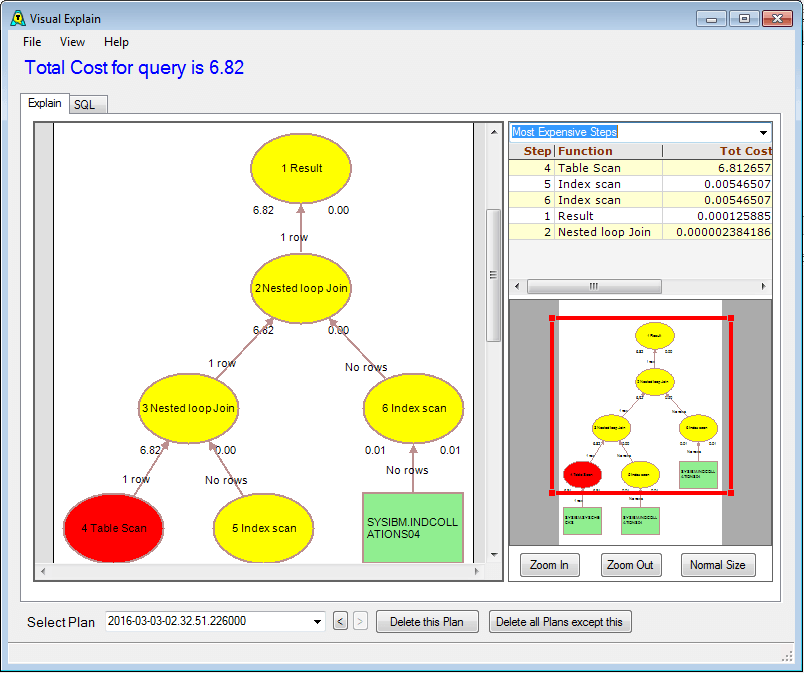
once you explain a query, you will be shown the Visual Explain window. This gives a graphical representation of how the database will process your query
the most resource-intensive step(s) are highlighted in red so are easily seen
the cost of each step, and number of rows passed to the next step, are given on the diagram
the grid at the top-right can display fuller information about your plan
for DB2/LUW, AQT can display the explain for explained packages
AQT Visual Explain
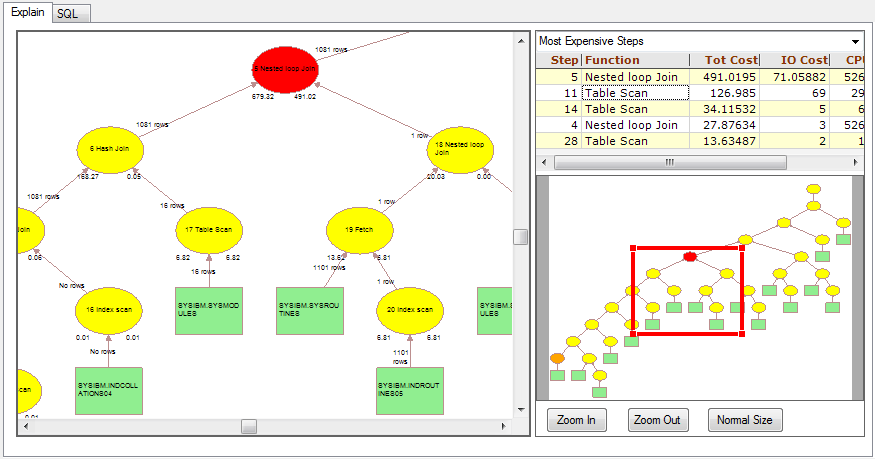
Complex Queries
for complex queries, the Diagram Controller makes it easy to zoom in/out and to navigate around a diagram.