![]()
![]()
![]()
![]()
|
|
|
|
|
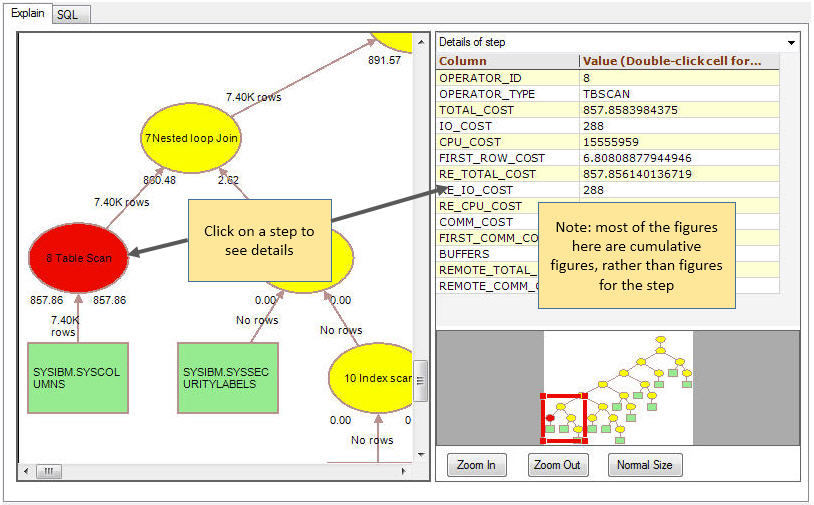
The elements on the Visual Explain diagram are shown as follows.
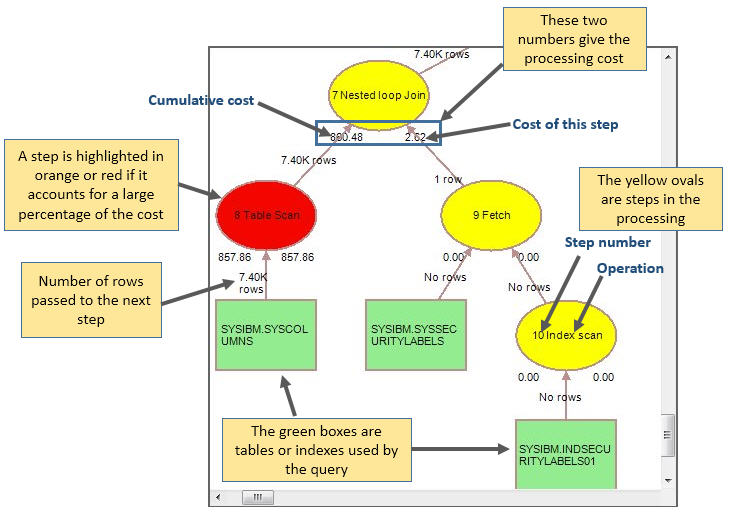
Number of rows and costs may be in units of K (1024), M (1024*1024) or G (1024*1024*1024).
You can find out more about a particular step (or table/index) by clicking on the item in the diagram.